Integrating Nessus Vulnerability Scanner into Splunk
In this blog post, I will explain how to integrate your Nessus vulnerability scan data into Splunk. We will use a single Splunk instance, as described in this blog post. Installation of Nessus can be found here. Configuring your first vulnerability scan is described in this blog post.
Splunk is a poweful tool to visualize data, which we want to use in this tutorial to visualize the Nessus vulnerability scan data. In order to achieve this, we will install a new Splunk app, which will collect the data over the Nessus API.
Install Splunk Add-On for Tenable
First of all, we need to download the Splunk Add-on for Tenable:
https://splunkbase.splunk.com/app/1710/

After downloading the Splunk App from Splunkbase, we need to install it. The first step is on clicking in Manage Apps:

Then, we click in Install app from file:

After that, we click on Durchsuchen / Choose and then on Upload:

Configure Nessus
Now, the Splunk App is installed. In order to be able to configure the Splunk Add-On for Tenable, we need an API Key for our Nessus vulnerability scanner. An API Key can be requested by navigating to your User Account and clicking on Generate:

Click again on Generate:

Copy the access_key and secret_key to a secure place, because you can’t access the keys again.
Configure Splunk
After preparing Nessus to collect the data, we configure Splunk. First, we create a new index for vulnerability data. Add this to /opt/splunk/etc/system/local/indexes.conf:
[va]
homePath   = $SPLUNK_DB/vadb/db
coldPath   = $SPLUNK_DB/vadb/colddb
thawedPath = $SPLUNK_DB/vadb/thaweddb
Afterwards, we will restart Splunk:
/opt/splunk/bin/splunk restartNow, let’s start to configure the Splunk_TA_nessus. When you download an app from Splunkbase and you want to make your own changes, we create a local folder in the app:
cd /opt/splunk/etc/apps/Splunk_TA_nessus/
mkdir local
cd local
We will create a new file inputs.conf with the following content:
[nessus://nessus_plugin]
metric = nessus_plugin
interval = 86400
url = https://nessus.patrick-bareiss.local:8834
access_key = ********
secret_key = ********
start_date = 1999/01/01
page_size = 1000
start_by_shell = false
disable_ssl_certificate_validation = true
index = va

[nessus://nessus_scan]
metric = nessus_scan
interval = 86400
url = https://nessus.patrick-bareiss.local:8834
access_key = ********
secret_key = ********
start_date = 1999/01/01
page_size = 1000
start_by_shell = false
disable_ssl_certificate_validation = true
index = va
Replace url, access_key and secret_key with your values and restart Splunk:
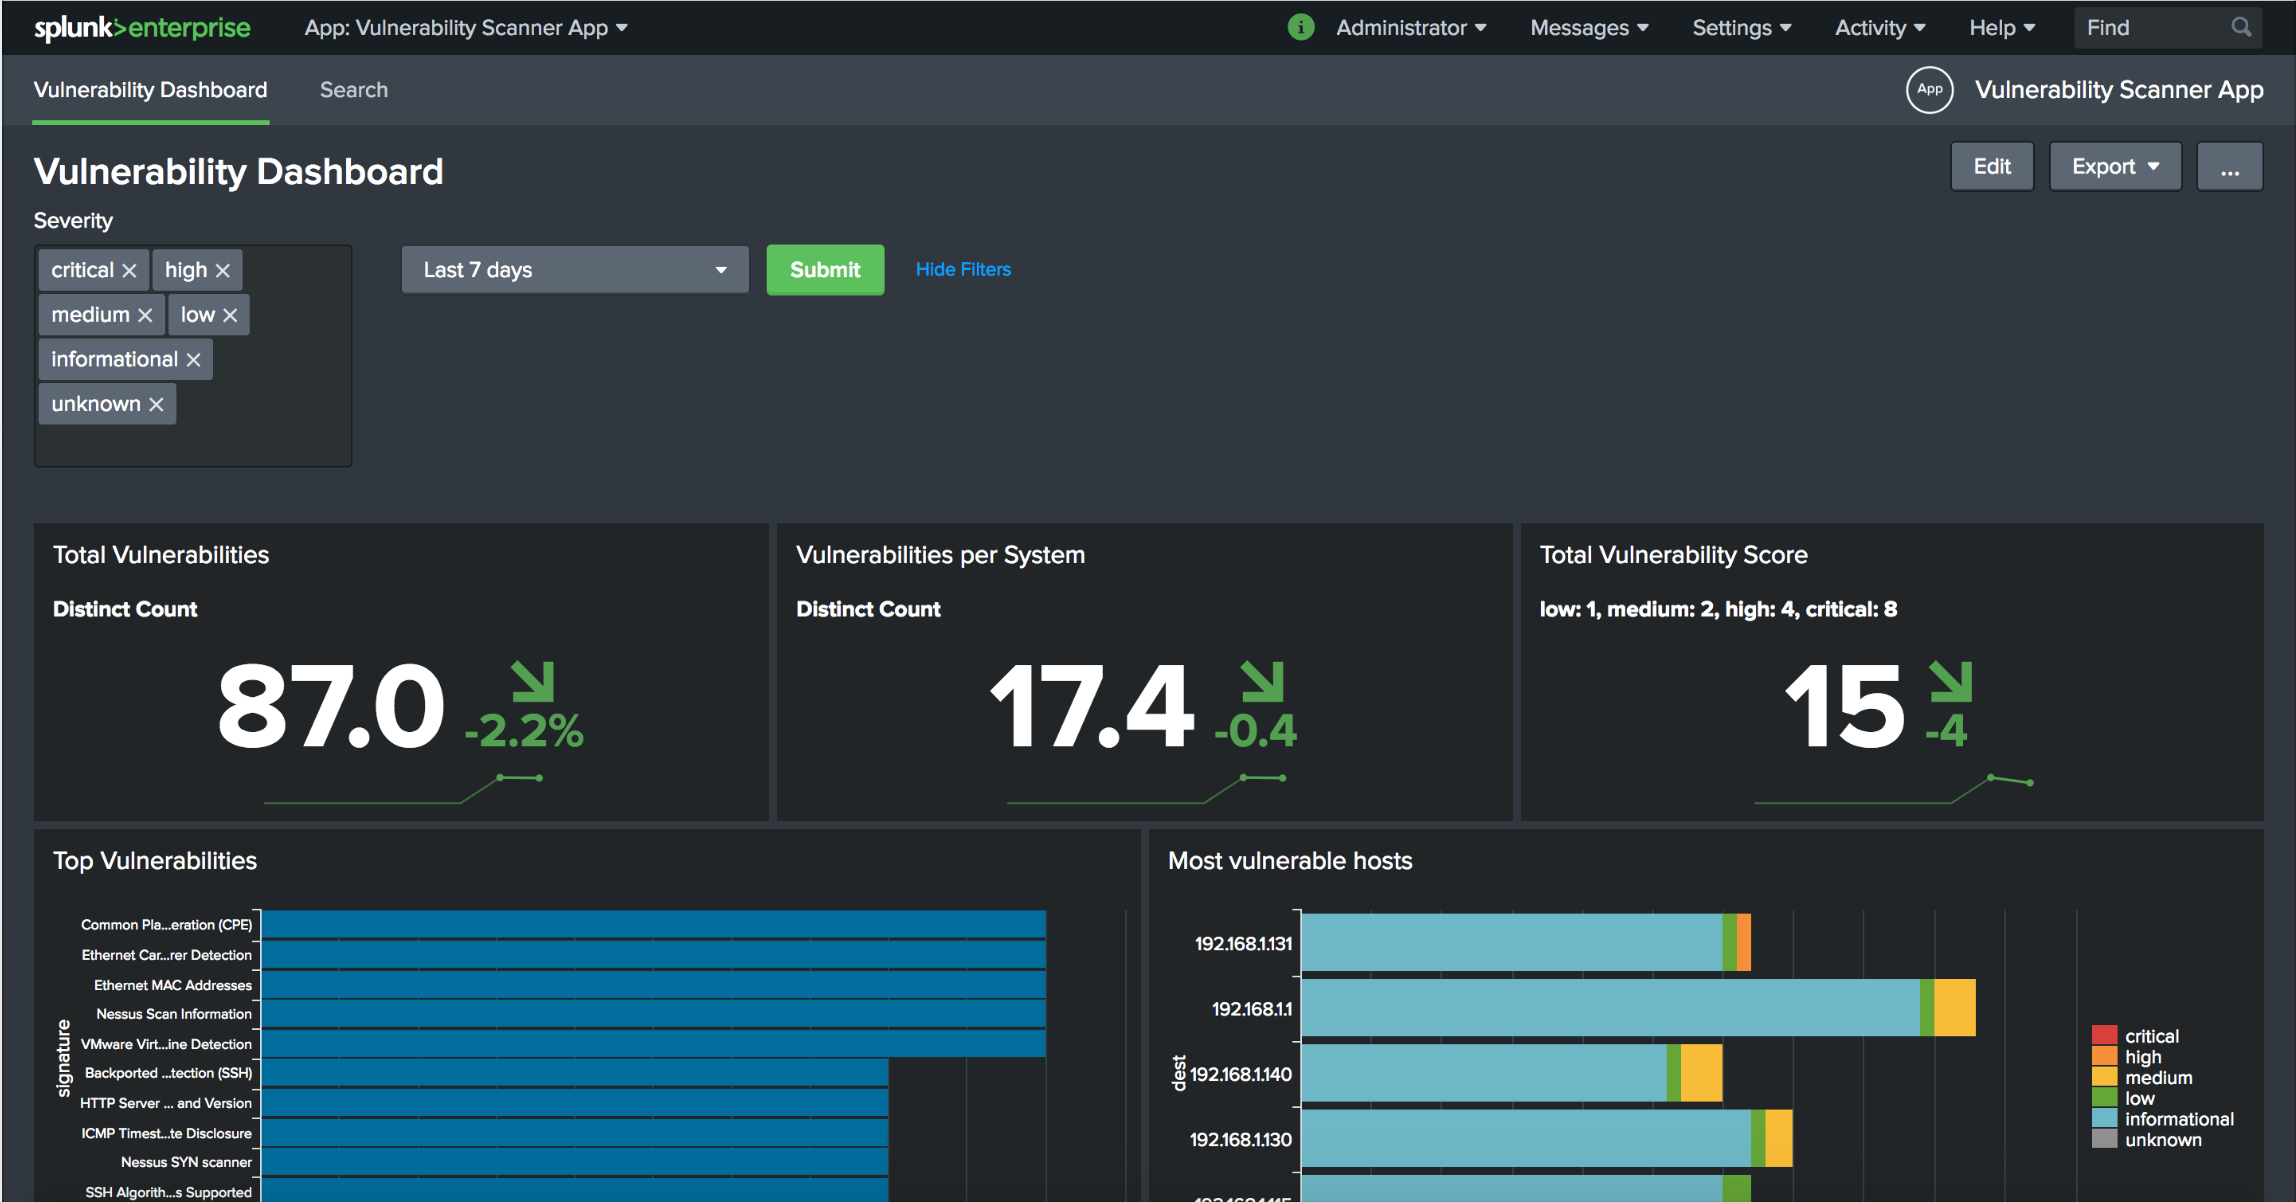
/opt/splunk/bin/splunk restartNow, we have the Nessus vulnerability scanner data in Splunk and can create a nice dashboard for it:

You can find the Vulnerbility Scanner App in github. Thank you for reading.
F*ckin?awesome things here. I am very glad to see your article. Thanks a lot and i am looking forward to contact you. Will you please drop me a mail?